 Skip to content
 No products added!
Category
Date Posted
January 8, 2026
/
No Comments
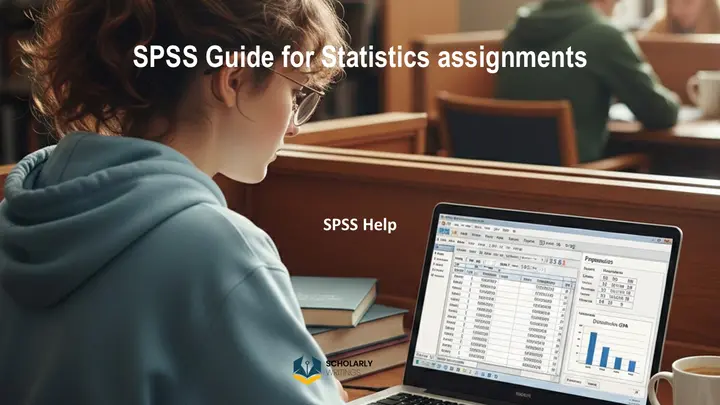
A Brief Guide to SPSS
SPSS stands for “Statistical Package for Social Science.” The brand name IBM® SPSS® resulted from IBM’s acquisition of the program from SPSS Inc. in 2009. The IBM® SPSS® package features all sorts of data analysis requiring visualization or the use of charts and graphs. It also helps compute descriptive statistics to summarize data and draw statistical inferences for univariate, bivariate, and multivariate data analysis. This guide to SPSS aims to help college students approach statistics assignments confidently.Supported Data Sources and Integration
Data analysts can import data from distinct sources such as:- MS Excel (.xlsx)
- Text files (.txt, .csv)
- Open Office
- Stata and SAS
- SQL databases
Navigating the SPSS Interface: Data View vs. Variable View
After opening the SPSS start-up window, the Statistics Data Editor appears, consisting of the Data View and Variable View. The window is similar to a spreadsheet, allowing the operator to define, enter, and edit data corresponding to different rows and columns.Understanding the Variable View
The Variable View consists of columns and rows used to enter all variables in the SPSS program. You should add all variables one by one row-side, mentioning their respective specifications:- Name & Type: Defining the variable identity.
- Width & Decimals: Adjusting numerical precision.
- Label & Values: Assigning descriptive names and coding categorical data.
- Missing, Measure, & Role: Defining how SPSS treats the data.
Navigating the Data View
The Data View window is used to enter numbers for each variable as assigned in the Variable View. Each row (serial number) represents a particular case or subject. For instance, serial number 1 presents the response of the first participant, and serial number 2 presents the responses of the second, and so forth.Analyzing Results in the IBM SPSS Statistics Viewer
The results of any executed analysis are displayed in the Output Viewer. This window appears automatically after performing analysis steps in the Data Editor. Results—including charts, graphs, and tables—can be copied, moved, or deleted as the user desires.The Four Scales of Measurement in SPSS
A critical step in SPSS data entry is comprehending scales of measurement. Knowing the scale of a variable helps in assigning the correct “Measure” in SPSS.-
Nominal Scale (Categorical Data)
- Example: Gender (1 = Male, 2 = Female) or Age Groups (1 = <10 years, 2 = 10-20 years).
-
Ordinal Scale (Ranked Data)
- Example: Product desirability ranked from 1 (Highly Desirable) to 5 (Least Desirable).
-
Interval Scale (Likert Scales)
- Example: A 5-point Likert scale measuring satisfaction (1 = Not satisfied at all; 5 = Highly satisfied).
-
Ratio Scale (Continuous Data)
Why Students Choose ScholarlyWritings.com for SPSS Help
Navigating the scales in this guide to SPSS and choosing the right tests (like T-tests, ANOVA, or Regression) can be overwhelming. ScholarlyWritings.com provides:- Accurate Data Entry: Transitioning raw survey data into SPSS without errors.
- Data Analysis: Comprehensive Descriptive & Inferential Statistics, Correlation & Regression Analysis, and Hypothesis Testing to ensure your results are scientifically sound.
- Detailed Interpretation: Beyond just generating tables, they provide the written analysis required for high-scoring assignments.
- 24/7 Support: Helping students meet tight deadlines for their statistics coursework.
Frequently Asked Questions
Which are the basic features of SPSS?
The IBM SPSS Data Editor consists of Variable View and Data View. Other important windows include the Output Viewer (results), Syntax Editor (programming), and Chart Editor (visual modifications).
What is the difference between the Variable and Data Views?
The Variable View defines the properties of your data (name, type, measure), while the Data View is where you input the actual raw numbers or responses for each case.
Which scales of measurement are used in the SPSS "Measure" column?
Nominal, ordinal, interval, and ratio are the primary options. You must select the correct one from the drop-down list to ensure your statistical tests run correctly.
How do I save my SPSS files?
- Data Files: Saved with the extension .sav.
- Output Files: Saved with the extension .spv.
January 8, 2026